Flag patterns are price patterns and charts that are often used by crypto investors and traders to see crypto market trends.
By looking at the trend of time, para crypto traders can decide the right strategy to make big profits. By reading the flag pattern, you can decide the right strategy to profit from crypto assets.
Charts are used with price reversals as opposed to the methods discussed in the past. In general, flag patterns are patterns with 5 to 20 candles that represent market trends. It means, candlesticks is a type of financial chart used to show future price movements in a market.


IDR 50,00062%
IDR 18,900
Definition of Flag Patterns
A flag pattern is a pattern on a price chart that is used to determine the probability of continuation of a previous market. The chart uses strong reversal patterns as opposed to price patterns that have been discussed at some point in the past.
Investopedia's Gordon Scott says that the origin of flag futures was created because price action appears as a standard, while the side of the flag shows strong price changes while the side of the pole shows price trends.
Various Flag Patterns
Basically, a flag pattern is a price movement pattern that gives a bullish or bearish signal, depending on the type and structure of the pattern.
Based on these indicators, the flag itself is divided into two types, namely the bullish flag which indicates a high price trend and the bearish flag which indicates a low price trend. The two types of patterns have almost the same structure, but with different trend directions and trading volume patterns.
Bullish Flag
The bullish flag pattern is a pattern that shows an upward price trend. Tony Spilotro of BTC News says that a bullish flag chart is an increase in the price of the previous trend, followed by a slight decrease in price which creates a “bullish flag”, a period of consolidation, and then a break (a higher and faster price increase than before).
Sam Ouimet from Coindesk reported that a bullish flag was seen during the Bitcoin price movement on February 20, 2017. A chart with a standard pattern is seen on the Bitcoin price movement from $917 to $1228.
Although not always accompanied by high numbers, Scott revealed that crypto analysts and traders are interested in this pattern because it shows great enthusiasm from new investors and crypto traders.
Also read: Crypto Airdrop: Understanding and How it Works
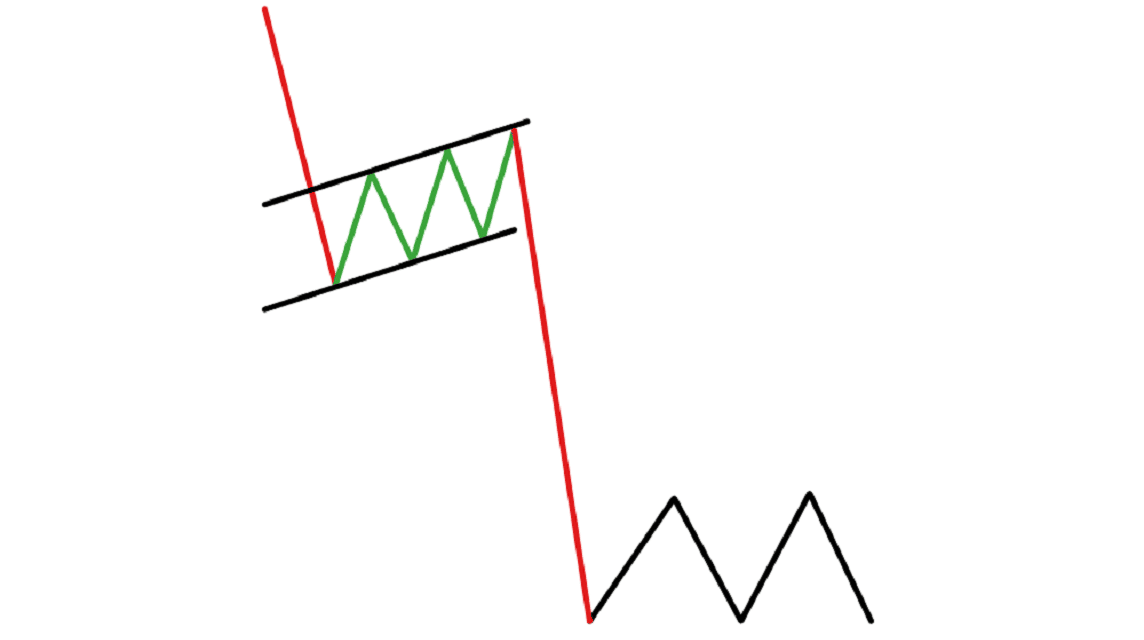
Bearish Flag
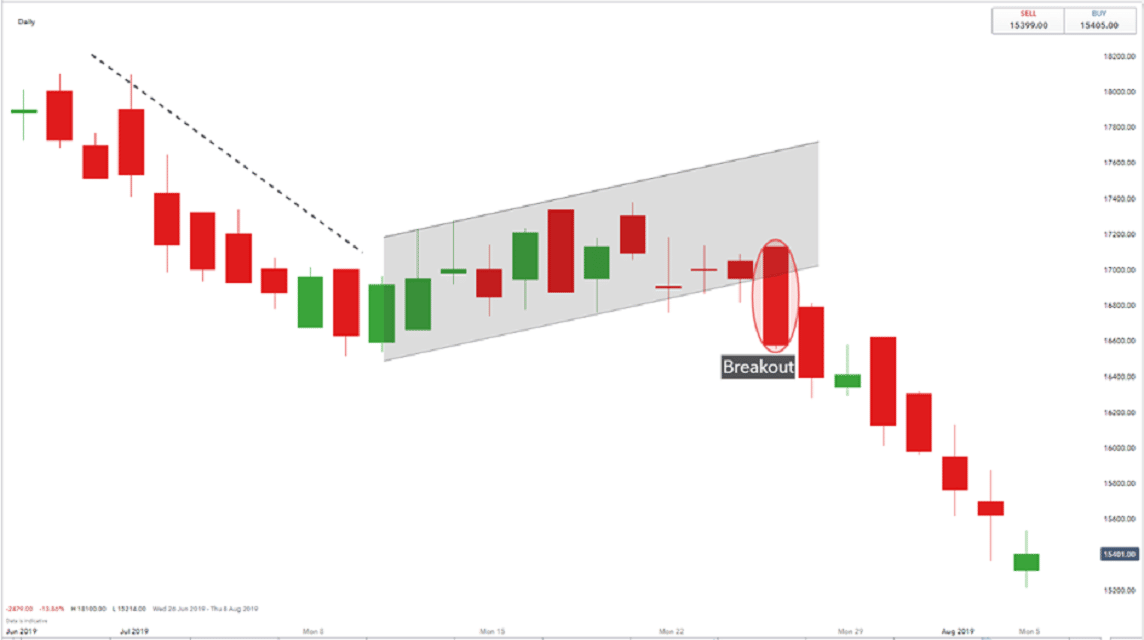
Bearish flag is a pattern that indicates bearish price conditions to investors and traders. This pattern is created by the lower price movement of the previous pattern, followed by the standard pattern up, and followed by the price pattern down.
A report from the Coindesk page, Ouimet writes that a bearish flag pattern can be found in the ETH price action data on March 17, 2018. Next to the bearish flag, the chart shows a dramatic price drop from $699 to $463.
Scott exposed during the communication period a small model didn't follow him in business. The lowest price is that seriously appreciates the concerns for financiers and goods experienced by the treasure economy of the Bank of the Future.
This content is intended to enrich the reader's information. Always do your own research and use cold funds before investing. All responsibilities of trading and selling in crypto assets are the responsibility of the reader.
Also read: What WD Means in the Crypto World, Understand This!
Don't forget, VCGamers has released a crypto token named VCG Tokens on the BSC network and ETH 20. This token can already be purchased at Indodax and BitMax.
Get it updating VCG Tokens the latest only on VCNews!