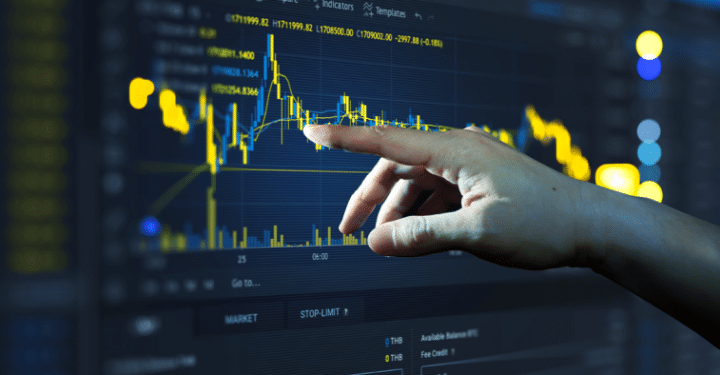
Investing and trading requires a clear understanding of the various aspects of the coin or stock you want to buy. You need to understand the value that assets provide and their future potential. Even understand technical analysis crypto also very important
In the crypto world, technical understanding of crypto analysis is very important because it is a fast growing new market. Dozens of crypto projects are created every year, and only a few become high-quality assets.
Therefore, different techniques must be used to assess the value and price of crypto assets. One possibility is technical analysis. So what is technical crypto analysis? Why is the selection of crypto assets so important? In this article, we will discuss a lot about technical crypto analysis.


IDR 50,00062%
IDR 18,900
Important Indicators In Crypto Technical Analysis
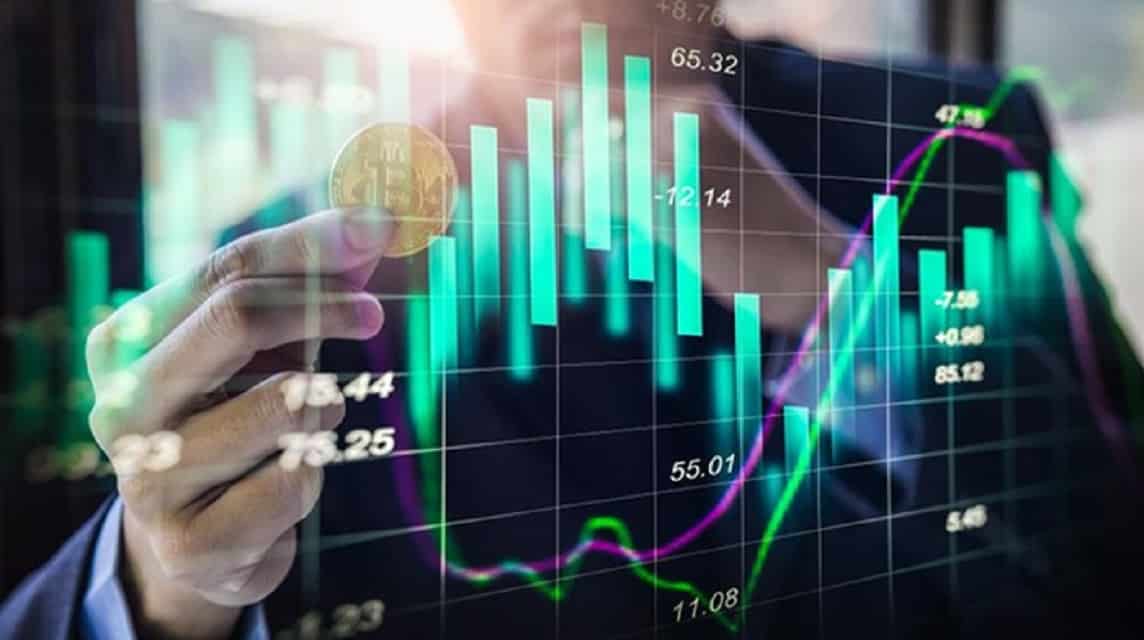
Technical analysis takes into account the history of cryptocurrency movements as well as price charts and trading volumes and everything that has been done with the token. Fundamental analysis, on the other hand, focuses on determining whether valuation or value coin high, fair, or low.
Trend Line
Trendlines, or the distinctive direction in which the price of a token moves, can be of great help to any cryptocurrency trader or investor. However, using this method is easier said than done.
Crypto assets can be very volatile. Observe the chart Bitcoins or other crypto asset price action can show a selection of highs and lows that form a linear pattern.
With this in mind, a technical analyst can ignore volatility and spot an uptrend by looking at a series of highs. Conversely, you can spot a downtrend by looking at a series of lows.
Resistance Levels
Apart from trend lines, there are also horizontal lines which show support and resistance levels. By identifying these levels, we can draw conclusions about the supply and demand for tokens.
At the support level, many investors and traders seem willing to buy the coin (big demand). Investors believe the currency is undervalued at current levels, so they try to buy.
A buy situation occurs when the token approaches this level. Strong demand usually stops the slide and sometimes even turns the momentum into an uptrend.
Resistance levels, on the other hand, are the exact opposite, an area where many traders are patiently waiting for a token sale. This creates a large feeding zone.
Each time a coin approaches this "limit", a large number of tokens will be sold and a large amount of supply will be returned.
Moving Averages
Moving Average is a technical analysis tool for crypto and other commodities to facilitate trend forecasting. Moving averages are based on the average price of tokens over a certain period of time.
For example, the average price movement for a given day is calculated using the token price for all 20 trading days leading up to that day. The data is then connected to form a line.
Finding the Exponential Moving Average (EMA) is also important. Where is the price moving average that gives more weight to the price value of the last few days than the last few days?
For example, the calculation factor for the last 5 trading days in a 15 day EMA scheme is double the calculation factor for the last 10 days.
Also read: How to Play Crypto for Beginners, Note This!
Trading Volume

Trading volume plays an important role in identifying trends in technical analysis. Strong trends are accompanied by high volume, and weak trends are accompanied by low volume.
When a coin falls, it's a good idea to check how much it dropped. A healthy long-term growth trend is accompanied by significant volume increases and volume decreases.
Also read: Easy Crypto Mining Tricks For Beginners, Do This!
It's also important to note that volume increases over time. If volume decreases during an uptrend, the uptrend will most likely end and vice versa during a downtrend.