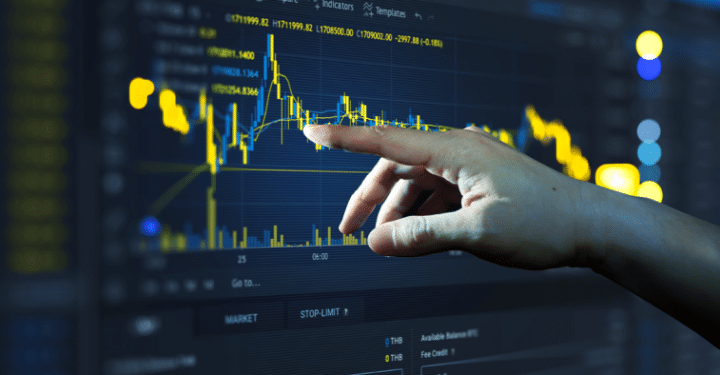
In the world of crypto trading, the ability to read candlesticks crypto or market movement charts are very important to learn, especially for novice traders.
By reading crypto candlesticks, you can make accurate technical analysis, especially when you need to make a decision.
Of course, learning it is not easy. Especially if you are a beginner and want to learn technical analysis and read charts or patterns at the same time.


IDR 50,00062%
IDR 18,900
However, you don't need to worry. This guide will help in reading crypto candlesticks and make it easier to make the best choice to trade crypto assets.
How to Read Crypto Candlesticks
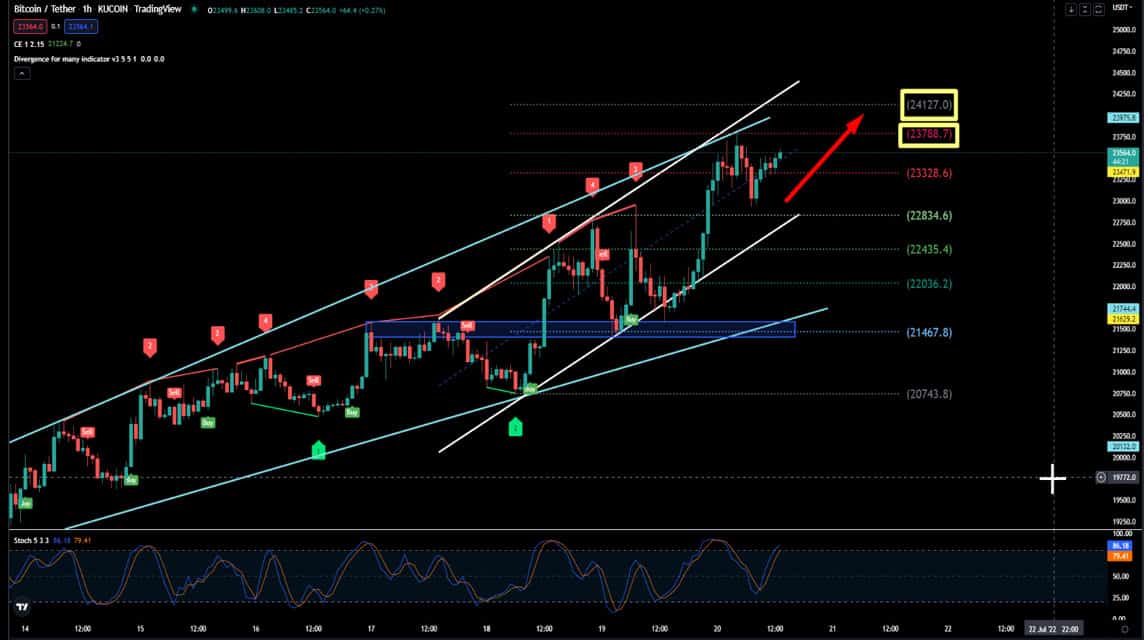
Chart patterns display all the important information about crypto asset prices in the digital asset market. Using the light method, you can set the correct entry and exit points and perform analysis. Candlestick patterns create different patterns and charts that can help in predicting future market trends.
Timing
Crypto candlestick patterns can make it easier to choose the time frame you want to display. You can choose movement time for 5 minutes, 15 minutes, 1 hour, 4 hours, daily, weekly or monthly. You can customize it according to your needs.
Volume
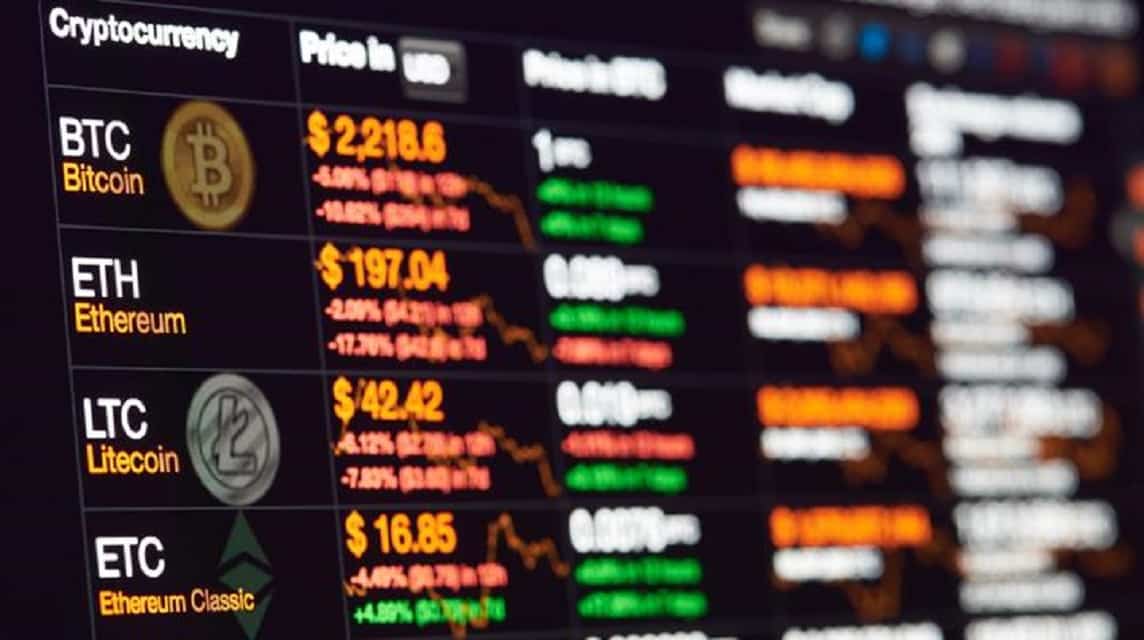
The chart pattern will reflect the volume of the crypto asset being traded at one time. Volume shows the amount of crypto assets purchased during the selected period. The higher the number, the more people buying or selling.
When the volume shows green, it means there is interest to buy cryptocurrencies. And if it shows red, it means less interest in the coin and selling pressure.
Also read: Daily Crypto Trading Tricks to Make Money Every Day!
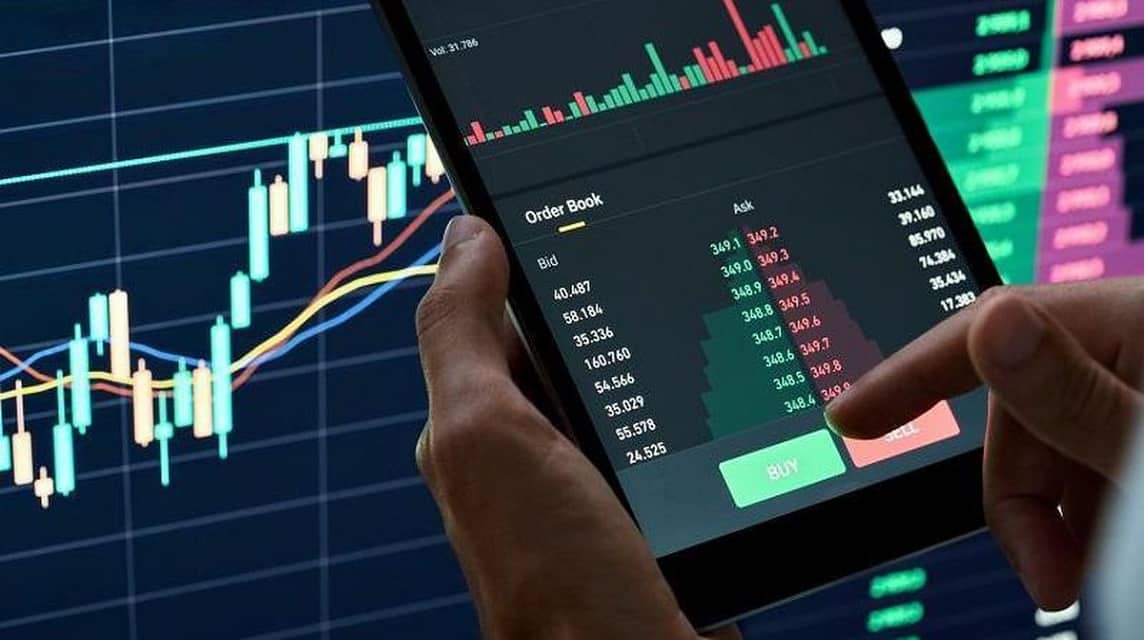
Bearish and Bullish indicators
There are two types of candlestick patterns, namely bearish and bullish. The green chart represents bullish candlesticks that show price increases over the selected timeframe. The top of the candle represents the closing price, while the bottom represents the opening price.
This situation is considered dangerous. A bearish spot represents a red candle indicating a decline in price. The top of the candle represents the opening price. When the bottom shows the closing price.
In conclusion, understanding technical analysis and reading each asset's crypto candlesticks is useful for overall financial and trading success. If it's your first time trading, it's a good idea to research carefully and understand charts and trends.
Also read: Understand Crypto Analysis Technical Indicators To Start Trading
Remember that prices will always fluctuate. There will always be opportunities to enter the market, so there is no rush to start trading.