Bearish flags are chart pattern bearish formed by two dips separated by a brief consolidation retracement period.
This pattern forms on a panicked, nearly vertical decline in price when the bulls are blinded by the sellers, then a bounce that has parallel upper and lower trendlines, forming a flag.
The initial sell-off ended through some profit-taking and formed a tight range that kept the lows slightly higher and the highs higher.


IDR 50,00062%
IDR 18,900
This illustrates that there is still selling pressure though trading also entered a long position looking for a reversal and this forced the price to drift upwards.
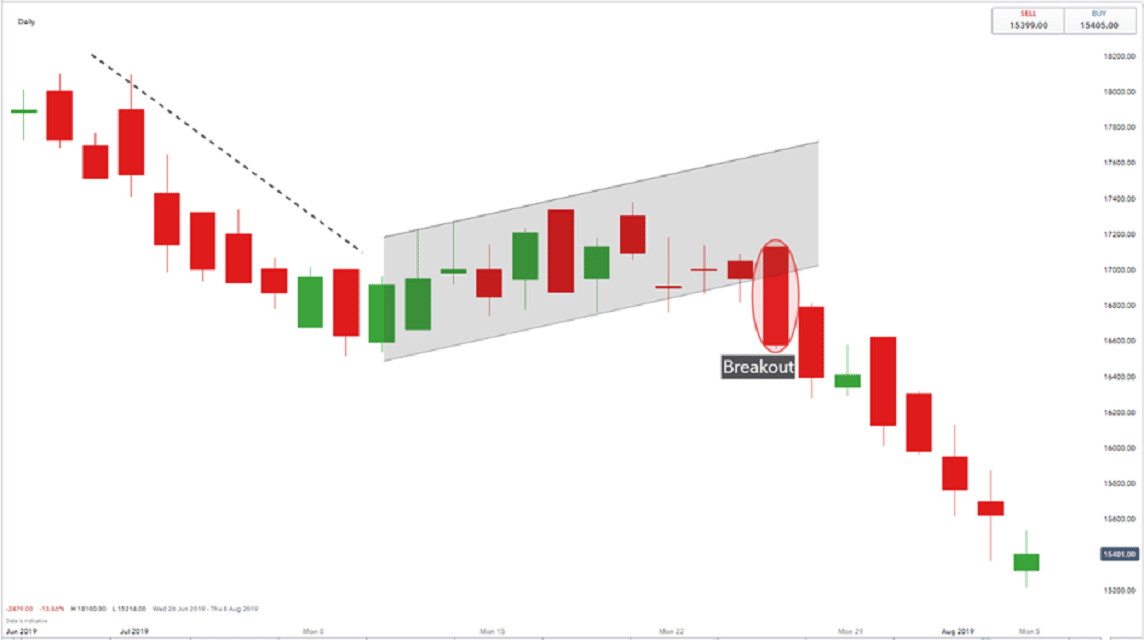
During consolidation, you should be prepared to take action if price breaks lower range levels and/or makes new lows as this shows the bears are in control again to force another selloff.
Understand Bearish Flags
Bearish flag is a pattern indicating a downtrend in the market. When the price is in a downtrend, the bearish flag pattern indicates stability and moves up quickly when the downtrend is strong. This suggests that there is selling pressure pushing the price lower than higher.
An example of a bearish trend in cryptocurrency occurs in price movements ETH on March 17, 2018. In a bearish scenario, the pole indicates a decline in price from US$699 to US$463.
How to Use Bearish Flag Values When Trading
You can enter the market when the asset price is above or below the standard trend. Indeed, the flag model is formed when there is increased demand or increased supply or lower prices.
In the case of the bull flag model, increased supply prevents prices from increasing. Therefore, prices can be adjusted and create a standard deviation. When the demand is greater than the supply, the price breaks above the standard above the resistance and the price continues.
Meanwhile, in the case of a bearish flag, increased demand prevents prices from falling. As a result, prices can rise and form a standard deviation.
When the supply is higher than the ask, the price will break above the standard below the support and the price will continue to fall later.
By using this model application, traders can determine a trading strategy by identifying three main factors, namely entry, stop loss and profit margin. According to Investopedia, traders can open positions after seeing a breakout or breakout point.
This is only to avoid the possibility of wrong patterns or only temporary signals on price movement charts in the market. One of the best ways for traders to predict profits when trading crypto is to calculate the distance from the bottom to the top of the standard.
For example, if the break point is at Rp. 80,000. Even though the core of the standard is the value of IDR 60,000 and the peak is IDR 150,000.
Often traders will use the low as a reference point, while the stop loss will be set several levels below the lowest low. prices are usually marked on a market price chart.
Also read: 5 Ways of Cryptocurrency Analysis for Beginner Traders
For those of you who don't know, currently VCGamers already has its own token named VCG Tokens. You can buy this token at Indodax and also BitMax.
Get it updating VCG Tokens the latest only on VCNews!