To maximize profit when trading, it is important to study candlestick patterns. One of candlestick pattern what needs to be learned is the inverted hammer candlestick because it can help give an idea of feelings and changes in behavior.
The inverted hammer candlestick is a pattern that forms when buyers pressure the market and start to trust the asset. This behavior indicates an increase that will increase the value of the asset. The pattern indicates the bottom of a downward price trend and indicates an upward price reversal.
To understand what an inverted hammer candlestick is and how to use it in trading, let's look at the following article.


IDR 50,00062%
IDR 18,900
Definition of Inverted Hammer Candlestick
The inverted hammer candlestick is a bearish reversal symbol indicating selling pressure from where it first fell and then rose. This pattern develops when buyers exert pressure on the market, suggesting an advance that will push the price of the asset higher.
This hammer is also a popular candle pattern among technical traders looking to time entries, exits and stop losses when trading. Apart from that, this hammer pattern can also appear in both bullish and bearish trends.
Compared to other candlestick patterns, this pattern is rare because it indicates uncertainty whether the market will go up or down. This pattern is also more complex than other light patterns, making it difficult to identify.
Nonetheless, this hammer candle is one of the most reliable patterns to indicate that the price has fallen and will soon start rising again.
How to Use the Inverted Hammer Candlestick in Trading
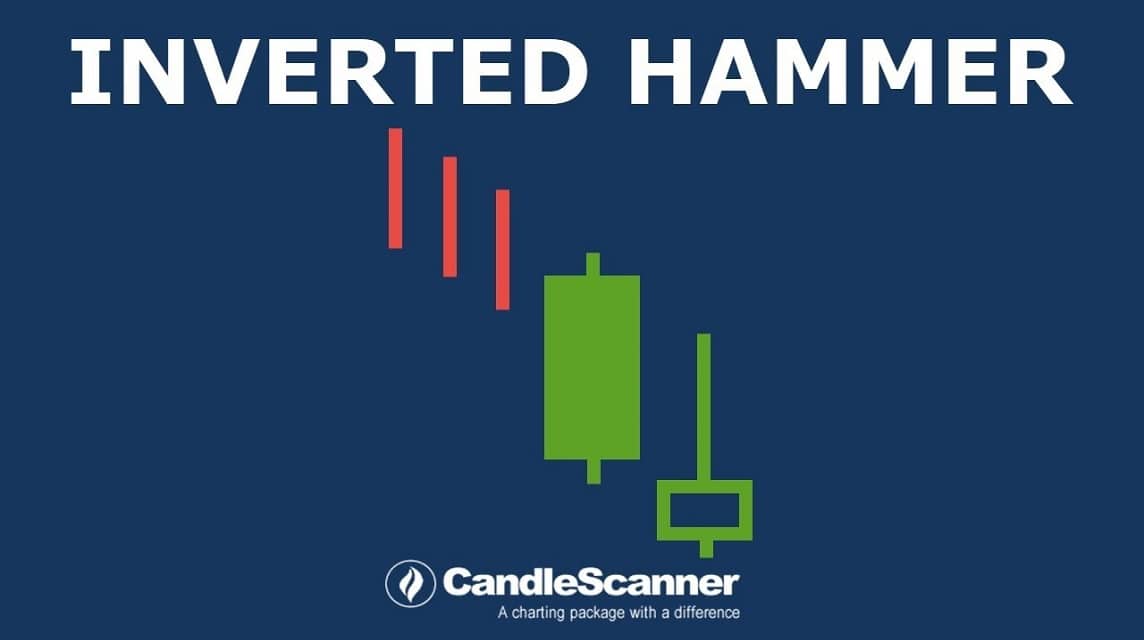
This pattern has long high shadows and no low shadows. The length of the shadow is usually twice the length of the lamp.
To define this pattern, find the shape of the pattern, where the upper axis is longer than the lower body is shorter. This pattern also means that the open, close and low prices are almost identical. Maybe later you will find this pattern in a green or red candle, depending on the circumstances.
When the low and the open price are the same, a green candle is formed and when the low and the close are almost the same, a red candle is formed.
Usually this candle is formed when the trader buys and regains confidence when the trader pushes the price lower. A bullish image is formed when the bulls try to push the price higher. Meanwhile, the bottom of the picture is made by the bears, who are trying to increase the price.
Also read: Fib Retracement Is An Analysis Technique, Here's The Explanation!
However, the pressure from the bulls was strong to close higher. Traders often confuse this candlestick pattern and the Shooting Star. But it should be noted that the hammer turn occurs when the fall is dropped when the start of firing occurs after the shot.
Trading when you see an inverted hammerhead candlestick pattern, start by looking for other signs that a reversal may be occurring.
If you agree, you can trade via CFD or spread betting. It is a derivative, which means you can trade at higher and lower prices.
Compared with technique technical analysis or some other fundamental research equation, this hammer candlestick pattern requires a lot of attention and market knowledge and can be used even by novice technical analysts.
It is important to know that before you start investing, you must first study and dig up information.
Also read: How to Read Crypto Candlesticks for Beginner Traders
Currently you can trade VCG Token on Indodax and Bitmax. Besides being able to trade, you can stake this VCGamers token.
Get the latest VCG Token updates every day only on VCNews!