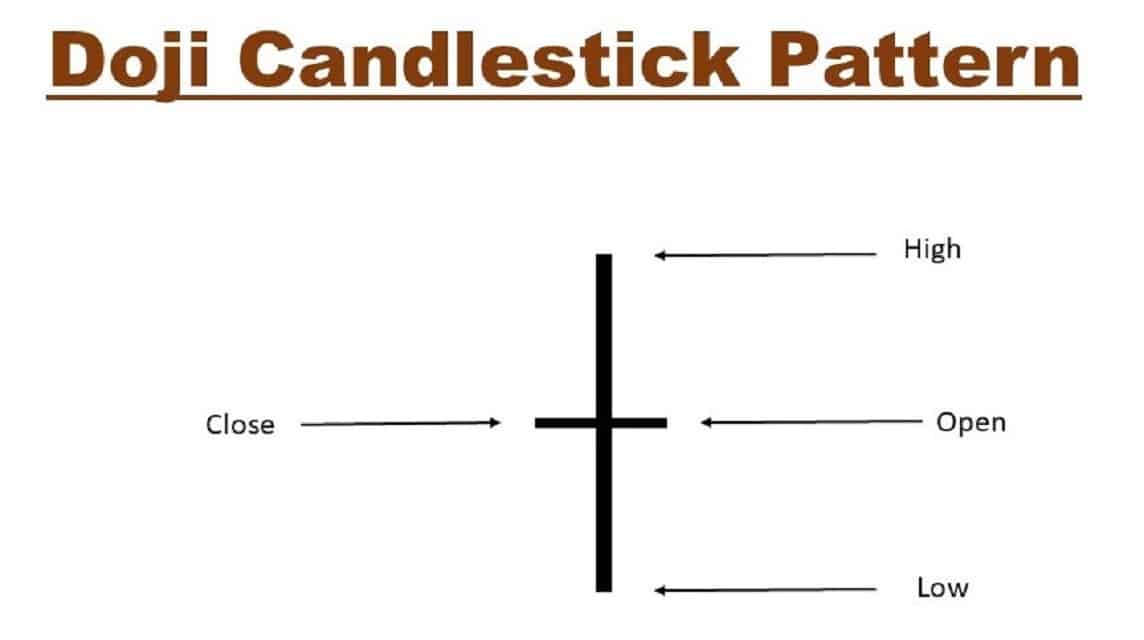
The doji candle is one of the most familiar candlestick patterns for traders traders. The reason is, this candle usually provides information to traders about these changes. Therefore, it is very important to know more about what a Doji candle is.
The doji candle is one trading signals most prominent in candlestick patterns. Since hundreds of years ago, lanterns have been used to trade rice products in Japan, and are still considered a valuable trade signal to this day.
In this crypto article, we will review information about understanding and how to use Doji candles. Let's take a look at the article below.
Doji Candles Are?
Doji candle is the name of a type of candle that traders often use to get information about trend reversals.
Doji is a candlestick that is formed when the open and close prices are almost the same for a certain period of time. In general, these patterns indicate changes in the market.
In Japanese, “Doji” means error, which refers to the lack of open and close prices that have the same value. The Doji pattern forms at least a few bars after the price goes up or down.
At that time, there was uncertainty among market participants about the direction the price would take next. It could be that the price is moving in the direction of the previous trend, or reversing.
So, a doji formation does not always indicate a trend reversal but can also indicate a continuation, depending on the confirmation of the next candlestick.
Also read: Definition of BEP20 and examples of tokens
How to Use the Doji Candle Pattern When Trading Crypto
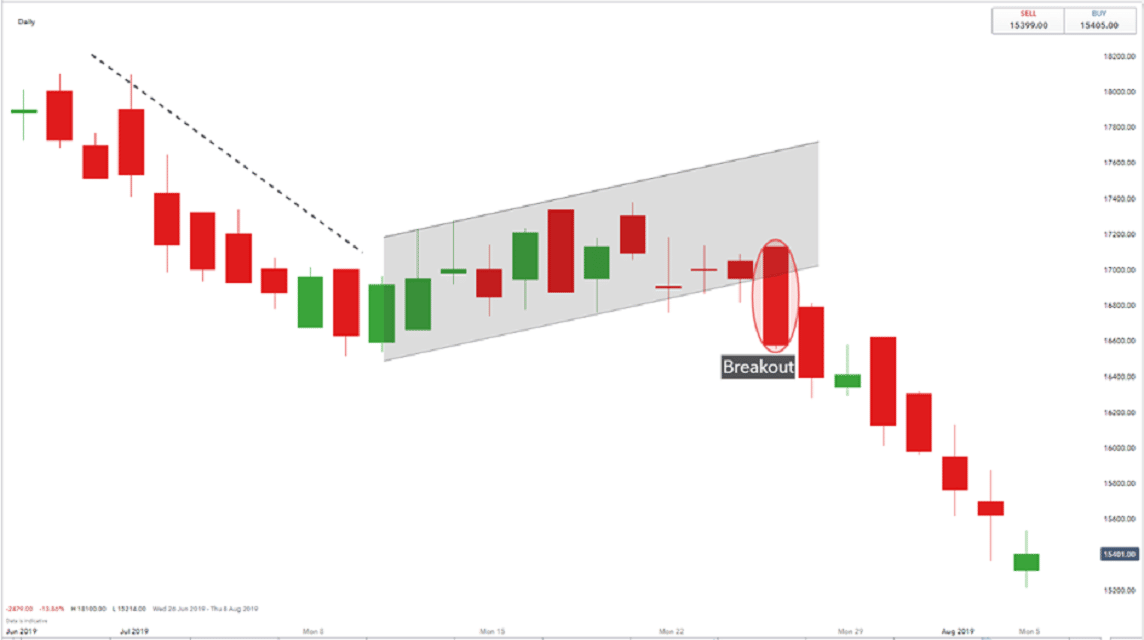
Some investors and traders view Doji as a sign of uncertainty in the market as to whether prices are going up or down. Therefore, the opening and closing prices are almost in the same area. For example, if you see the Dragonfly Doji approaching the bottom in June 2019.
Three Doji in a row were seen in late July before trending down, leading to the session closing with the Dragonfly Doji.
In addition, there were also several Dojis in mid-August, while the September Doji outlined in the chart closely matched the highs and lows.
One strategy for using a Doji is to look at the highs and lows as stops.
For example, if we see a downtrend and then see the Dragonfly Doji (as it did in June), we should look to go long and trade a reversal after price breaks above (or closes above) the high of the Dragonfly Doji.
As explained, the Doji itself indicates a “market decision”. After a period of time, the market may decide to change or continue to do so now.
Therefore, Doji Candlestick signals should be considered as “reversals” only and not as “reversal signals”. Candle Hero can be part of a higher candle as morning star, evening star, abandoned and others.
Doji without a lower level, but a candle formed when it would have been better. You can mark a crypto where the Doji appears in anticipation of this formation.
Also read: Get to know Sollet, the Solana Token Wallet
VCGamers provides tons of news and information about the world of cryptocurrencies, blockchain, and investing in general in an easy to understand language with great tips you can try.
You can even buy the named VCGamers token VCG Tokens on Indodax and BitMax. This token itself is on the BSC network and ETH 20 which you can stake to get interest.
Get it updating VCG Tokens the latest only on VCNews!
